
Welcome to www.leuluandco.com! Our website is using Cookies.
To enhance your experience, we use cookies. By clicking ‘Continue,’ you consent to the use of all cookies. To learn more about how we handle your data, please review our Privacy Policy.
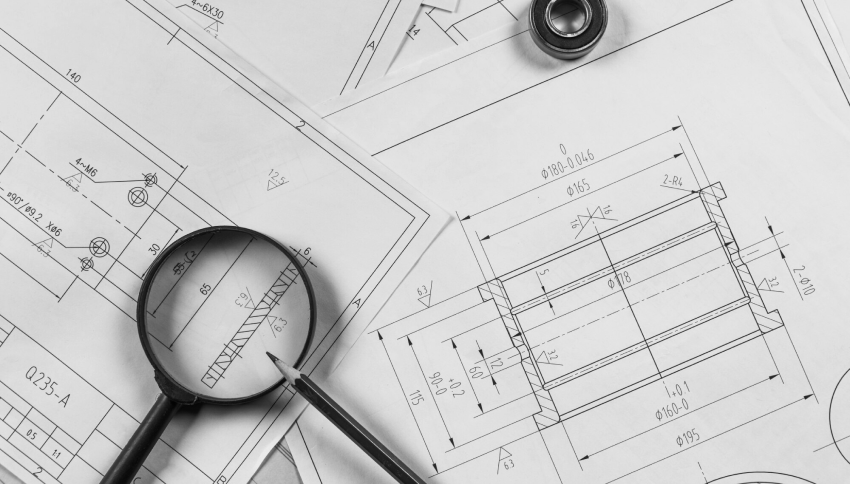
Schematics and maps are both visuals, but with different goals:
Think of maps as guides and schematics as blueprints.
Here are some examples of Schematics
and Maps graphics:
Both cross-section schematics and maps use a vertical axis to represent depth or height. They may exaggerate the vertical scale for better visualization of internal features. Reference lines or labels are often used to indicate the location of the “cut” on the corresponding top-down view (map) or schematic.
Maps focus on showing the spatial relationships between things in the real world. They typically use features like:
A floor plan falls somewhere between a schematic and a map. It uses a:
Its purpose is to give a clear understanding of the building’s layout, but not necessarily to scale.
An exploded diagram is a kind of blueprint for taking things apart or putting them together. It shows an object broken down into its individual parts, separated slightly as if by a small explosion. This reveals how the parts fit and can be used for assembly instructions, repair manuals, or just to see how something works inside.

A cutaway graphic is a type of illustration that reveals the inside of an object by removing a portion of its exterior. It’s like a visual slice through something, allowing you to see the internal parts and how they fit together, all while keeping the object in context with its surroundings. Cutaway graphics are often used in instruction manuals, engineering diagrams, and scientific visualizations.
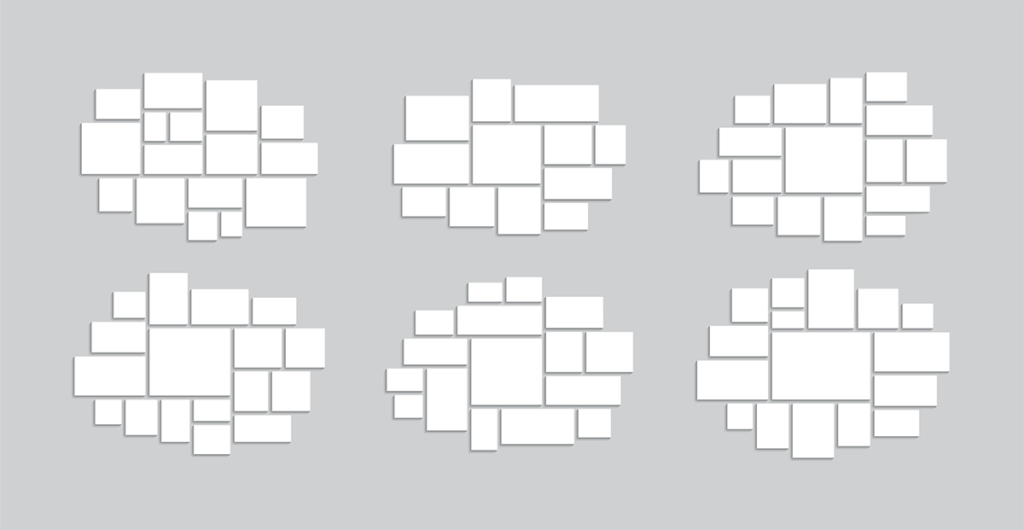
Collaging schematics and maps combines the strengths of both:
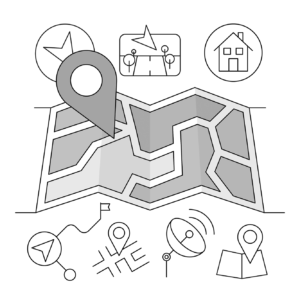
Illustrations play a key role in both schematics and maps, but in different ways:
Get a Free Consultation to Discuss Your Project Goals Today!
To enhance your experience, we use cookies. By clicking ‘Continue,’ you consent to the use of all cookies. To learn more about how we handle your data, please review our Privacy Policy.
